

Tuning-free variable selection with the Pivotal Information Criterion.
picreg fits sparse regression, classification and
survival models with the Pivotal Information Criterion
(PIC) of Sardy, van Cutsem
and van de Geer (2026). Like BIC or AIC, PIC fixes its penalty level
before looking at the response. Unlike them, it fixes it at the
detection boundary: the smallest penalty that keeps
pure noise out of the model with probability \(1 - \alpha\). This penalty depends only on
the design matrix, so PIC needs neither cross-validation nor a grid of
models, and it selects sparse, interpretable models with a controlled
number of false discoveries.
X, without cross-validation, validation set or
path selection.glmnet-style API. The core is
written in C++ (RcppArmadillo).Install the released version from CRAN:
install.packages("picreg")or the development version from GitHub:
# install.packages("remotes")
remotes::install_github("VcMaxouuu/picreg")QuickStartExample is a Gaussian dataset with \(n = 100\) observations and \(p = 30\) predictors, of which only
gene_1, …, gene_5 carry signal.
library(picreg)

data(QuickStartExample)
X <- QuickStartExample$X
y <- QuickStartExample$y

fit <- pic(X, y, lambda_seed = 1)   # lambda_seed: reproducible calibration
summary(fit)
#> pic fit summary
#>   family    : gaussian
#>   penalty   : lasso
#>   lambda    : 0.3081
#>   dimensions: n = 100, p = 30
#>   selected  : 5 / 30
#>   intercept : 0.005989
#>
#>   Non-zero coefficients (original scale):
#>  variable coefficient
#>    gene_3     -0.7606
#>    gene_4     -0.6620
#>    gene_1     -0.4130
#>    gene_5      0.1495
#>    gene_2     -0.0571
The five active variables are recovered exactly, without any tuning. The fit works with the usual methods:
coef(fit)                              # sparse coefficients, original scale
predict(fit, newx = X[1:3, ])          # predictions on new data
plot(fit)                              # lollipop plot of the selected effects
assess(fit, newx = X, newy = y,        # predictive and support-recovery metrics
       true_features = paste0("gene_", 1:5))
Changing the model or the penalty only takes an argument; the calibration can be reused across penalties, since it does not depend on them:
fit_scad <- pic(X, y, penalty = "scad", lambda = fit$lambda_pdb)

data(BinomialExample)
fit_logit <- pic(BinomialExample$X, BinomialExample$y, family = "binomial")

data(CoxExample)
fit_cox <- pic(CoxExample$X, CoxExample$y, family = "cox")| Model | family = |
Response y |
Loss minimized by PIC |
|---|---|---|---|
| Linear regression | "gaussian" |
numeric | square root of the mean squared error (square-root lasso) |
| Logistic regression | "binomial" |
0/1, logical, or two-level factor | weighted score loss |
| Poisson regression | "poisson" |
non-negative counts | weighted score loss |
| Exponential regression | "exponential" |
non-negative | negative log-likelihood |
| Gumbel location-scale | "gumbel" |
numeric | exponential of the negative log-likelihood, scale profiled out |
| Cox proportional hazards | "cox" |
(time, event) matrix or
survival::Surv |
square root of the negative log partial likelihood (Breslow ties) |
Each model is combined with one of three penalties:
"lasso" (\(\ell_1\)),
"scad" or "mcp". The non-convex penalties
reduce the shrinkage bias of the lasso on large coefficients and recover
the support at higher sparsity levels.
PIC minimizes
\[ \phi\Bigl(l_n\bigl(g(\beta_0\mathbf{1} + X\boldsymbol\beta)\bigr)\Bigr) + \lambda_\alpha^{\mathrm{PDB}}\, \mathrm{pen}(\boldsymbol\beta), \]
where \(l_n\) is a base loss and
\((\phi, g)\) are model-specific
transformations. The origin \(\boldsymbol\beta
= \mathbf 0\) is a solution as soon as the penalty exceeds \(\Lambda\), the sup-norm of the gradient of
the loss at the null fit. PIC sets the penalty at the pivotal
detection boundary \(\lambda_\alpha^{\mathrm{PDB}}\), the \((1 - \alpha)\)-quantile of \(\Lambda\) under pure noise. The
transformations \((\phi, g)\) are
chosen so that this quantile does not depend on the unknown intercept or
scale: it can be computed from X alone, before the model is
fitted.
pic() computes \(\lambda_\alpha^{\mathrm{PDB}}\) with one of
three methods, through lambda_method:
| Method | Principle | When to use |
|---|---|---|
"mc_exact" (default) |
Monte Carlo under the null model of the family | small to moderate problems |
"mc_gaussian" |
Monte Carlo under the Gaussian limit of the gradient | large \(n\) |
"analytical" |
closed-form Bonferroni bound, conservative | very large problems |
pdb_summary(fit)        # calibration details and simulated null distribution
plot(fit$lambda_pdb) # null distribution with the selected lambdaThe results below are reported in Sardy, van Cutsem and van de
Geer (2026), and the scripts that produce them are in simulations/.
Calibration under pure noise. On Gaussian data with
\(n = p = 100\) and no signal, PIC
selected at least one variable in 4% of the datasets, for a target of
\(\alpha = 5\%\). Cross-validated lasso
(cv.glmnet, lambda.min) did so in 43% of the
datasets, EBIC in 22% and BIC in 96%.
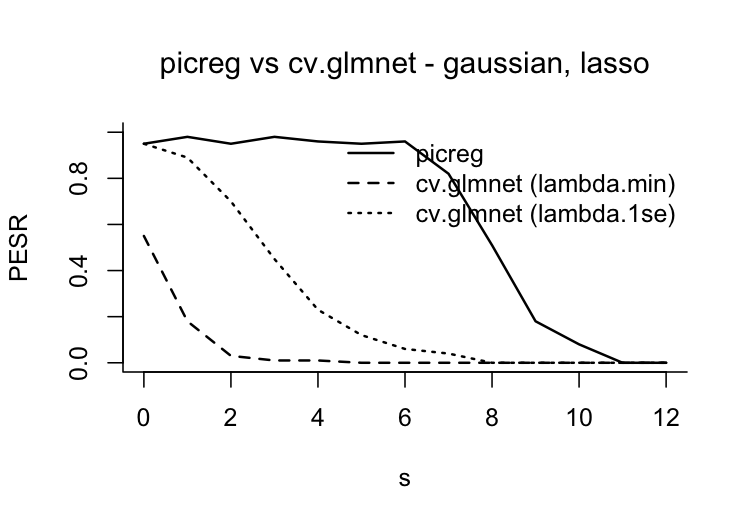
Phase transition. Probability of exact support recovery as a function of the number \(s\) of active variables (Gaussian model, \(n = p = 100\), non-zero coefficients of magnitude 3 with random signs, 100 replications per \(s\)):
Real data. Mean test performance (mean model size in parentheses) over 100 random 70/30 train-test splits (90 for Riboflavin), after an unpenalized refit on the selected variables. BIC and EBIC use forward selection.
| Dataset | \(n\) | \(p\) | PIC (lasso) | PIC (SCAD) | cv.glmnet | BIC | EBIC |
|---|---|---|---|---|---|---|---|
| Regression, relative test MSE | |||||||
| Prostate cancer | 97 | 8 | 0.435 (3.1) | 0.456 (2.7) | 0.451 (5.9) | 0.454 (3.1) | 0.460 (2.8) |
| Diabetes | 442 | 64 | 0.531 (4.6) | 0.535 (4.7) | 0.536 (17.6) | 0.529 (6.3) | 0.542 (4.7) |
| Riboflavin | 71 | 4088 | 0.411 (6.0) | 0.411 (6.0) | 1.323 (37.5) | 0.754 (40.0) | 0.492 (8.0) |
| Classification, test accuracy | |||||||
| Breast cancer | 569 | 30 | 0.965 (4.5) | 0.950 (3.0) | 0.963 (12.9) | 0.962 (5.2) | 0.963 (4.3) |
| Ionosphere | 351 | 33 | 0.872 (4.6) | 0.867 (4.3) | 0.878 (17.5) | 0.867 (8.0) | 0.864 (6.0) |
| Sonar | 208 | 60 | 0.715 (4.0) | 0.720 (3.3) | 0.735 (19.8) | 0.729 (7.6) | 0.722 (4.4) |
On every dataset, a PIC fit selects the smallest model, with a predictive performance close to the best one.
| Task | Functions |
|---|---|
| Fit a model | pic() |
| Inspect a fit | summary(), coef(),
plot() |
| Predict and evaluate | predict(), assess() |
| Penalty calibration | lambda_pdb(), pdb_summary(),
plot(fit$lambda_pdb) |
| Survival analysis | predict(type = "survival"),
feature_effects_on_survival(),
plot_survival_curves(), plot_baseline(),
concordance_index() |
| Diagnostics | phase_transition(), pdb_asymptotic() |
vignette("vignette", package = "picreg"))If you use picreg, please cite:
Sardy, S., van Cutsem, M. and van de Geer, S. (2026). The Pivotal Information Criterion. arXiv:2603.04172. https://doi.org/10.48550/arXiv.2603.04172
@article{sardy2026pic,
  title   = {The Pivotal Information Criterion},
  author  = {Sardy, Sylvain and van Cutsem, Maxime and van de Geer, Sara},
  journal = {arXiv preprint arXiv:2603.04172},
  year    = {2026},
  doi     = {10.48550/arXiv.2603.04172}
}
Related work:
Bug reports and feature requests are welcome on the issue tracker.
GPL-2. See the GNU General Public License, version 2.