ss3sim is an R package that facilitates flexible, rapid, and reproducible fisheries stock assessment simulation testing with the widely-used Stock Synthesis (SS) statistical age-structured stock assessment framework.
Install the CRAN version of ss3sim with:
install.packages("ss3sim")Or, install the development version from GitHub:
# install.packages("devtools")
devtools::install_github("ss3sim/ss3sim",
  ref = "development", build_vignettes = TRUE, dependencies = TRUE)
library(ss3sim)
We suggest using the GitHub version because it comes with the SS
executable/binary. If you are using the CRAN version, you’ll need to
install the binary and place it in your system path. See the
Introduction vignette with
vignette("introduction", "ss3sim") for more details on how
to get the latest version of SS and place it in your path.
You can read the help files and access the vignettes for reproducible examples of ss3sim simulations with
?ss3sim
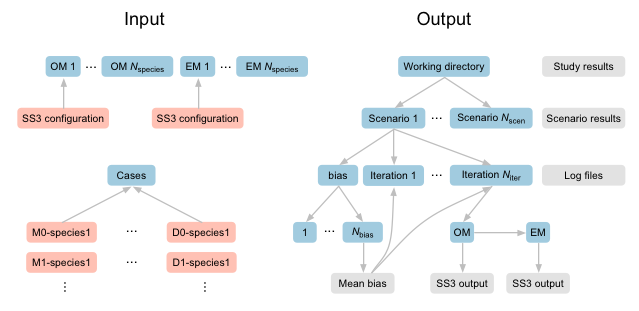
browseVignettes("ss3sim")An ss3sim simulation requires three types of input:
You can find examples of these SS operating and estimation models within the package data. Plain-text case files for some current simulation projects run by the developers of the package are also available along with the case files for the examples used in the paper and vignette.

An illustration of the input and output file and folder structure.
ss3sim works by converting simulation arguments (e.g., a given natural mortality trajectory) into manipulations of SS configuration files. It takes care of running the operating and estimation models as well as making these manipulations at the appropriate stage in the simulation.
ss3sim functions are divided into three types:
change and sample functions that
manipulate SS configuration files. These manipulations generate an
underlying “truth” (operating models) and control our assessment of
those models (estimation models).
run functions that conduct simulations. These
functions generate a folder structure, call manipulation functions, run
SS3 as needed, and save the output.
get functions for synthesizing the output.

Example output from an ss3sim simulation. This example shows a crossed simulation in which we considered (1) the effect of fixing natural mortality (M) at its true value (0.2; case E0) or estimating M (case E1) and (2) the effect of high survey effort (sigma_survey = 0.1; case D0) or low survey effort (sigma_survey = 0.4; case D1). Upper panels (blue) show time series of relative error in spawning stock biomass (SSB). Lower panels (grey) show the distribution of relative error across four scalar variables: depletion, M, SSB at maximum sustainable yield (SSB_MSY), and fishing mortality (F) in the terminal year. We show the values across simulation iterations with dots and the distributions with beanplots (kernel density smoothers).
If you use ss3sim in a publication, please cite ss3sim as shown by
citation("ss3sim")
toBibtex(citation("ss3sim"))“The United States Department of Commerce (DOC) GitHub project code is provided on an ‘as is’ basis and the user assumes responsibility for its use. DOC has relinquished control of the information and no longer has responsibility to protect the integrity, confidentiality, or availability of the information. Any claims against the Department of Commerce stemming from the use of its GitHub project will be governed by all applicable Federal law. Any reference to specific commercial products, processes, or services by service mark, trademark, manufacturer, or otherwise, does not constitute or imply their endorsement, recommendation or favoring by the Department of Commerce. The Department of Commerce seal and logo, or the seal and logo of a DOC bureau, shall not be used in any manner to imply endorsement of any commercial product or activity by DOC or the United States Government.”